随机生成2019年1月1日至2019年10月16日的某商品的销售数据(不考虑外界因素对商品销售的影响),预测该商品在未来几天的销售情况 。
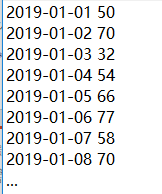
历史销售数据格式(第一列为日期,第二列为销售数量)
要求:
预测模型不限
预测出2019年10月17日销售数据
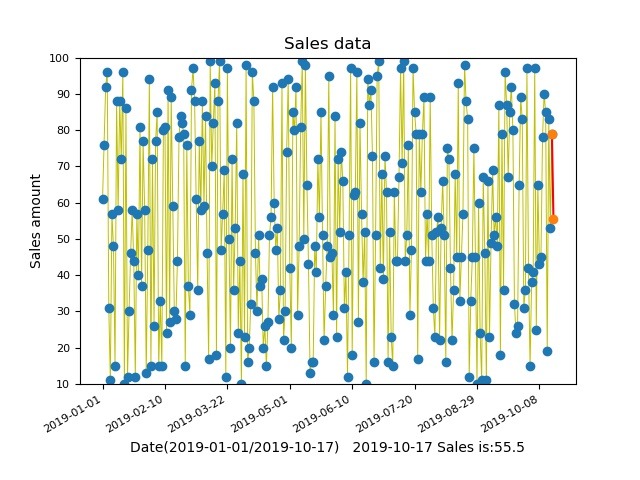
折线图方式展示历史销售数据和预测销售数据 ,预测出来的那段线不同颜色标出
python代码:
# 导入库
import matplotlib.dates as mdate
from datetime import datetime
import re
import numpy
from sklearn import linear_model
from matplotlib import pyplot as plt
import matplotlib.pylab as pyl
from matplotlib.pyplot import MultipleLocator
import csv
import pandas as pd
import random
import datetime
import os

if os.path.isfile("data3.txt")==False: #判断是否生成data3 生成跳过此段代码
    #######第一次运行生成随机生成日期与销量数据#########
    fn = 'data3.txt'
    with open(fn, 'w', newline='') as fp:
        wr = csv.writer(fp)
        # wr.writerow(['日期','销量'])
        startDate = datetime.date(2019, 1, 1)

        for i in range(1, 290):
            amount =10+random.randrange(90)
            wr.writerow([str(startDate) + ' ' + str(amount)])
            startDate = startDate + datetime.timedelta(days=1)
    ####################################

# 导入数据
fn = open('data3.txt', 'r')    # 打开名为“data.txt”的文件,文件模式是只读,并创建一个名为fn的文件对象
all_data = fn.readlines()    # 从fn中读取的行记录,并保存到一个名为all_data的列表中
fn.close()    # 关闭文件对象的占用

# 数据预处理
x = []
y = []    # 创建两个空列表
for single_data in all_data:    # 通过一个for循环每次从列表all_data中读取一条数据,并赋值给single_data
    tmp_data = re.split('-| |\n', single_data)    #对single_data进行数据分割,分割结果赋值为tmp_data
    #print(tmp_data)
    a = numpy.array(int(tmp_data[0]))
    b = numpy.array(int(tmp_data[1]))
    c = numpy.array(int(tmp_data[2]))
    d=a*10000+b*100+c
    x.append(int(d))
    y.append(int(tmp_data[3]))  # 将tmp_data的第一个值和第二个值分别追加到列表x和y中。
x5=[]
y5=[]
for single_data in all_data:    # 通过一个for循环每次从列表all_data中读取一条数据,并赋值给single_data
    tmp_data = re.split(' |\n', single_data)
    x5.append(tmp_data[0])
    y5.append(int(tmp_data[1]))

x2=x
y2=y
x = numpy.array(x).reshape([289, 1])
y = numpy.array(y).reshape([289, 1])# 将x和y由列表类型转换为数组类型 .reshape([289, 1])

# 数据分析展示
# 数据建模
model = linear_model.LinearRegression()    # 创建一个模型对象
model.fit(x,y)    # 将x和y分别作为自变量和因变量输入模型进行训练

# 模型评估
model_coef = model.coef_    # 获取模型的自变量系数并赋值为 model_coef
model_intercept = model.intercept_    # 获取模型的截距并赋值为 model_intercept
r2 = model.score(x, y)    # 获取模型的决定系数R的平方
# print(model_coef,model_intercept,r2)

new_x = 20191017   # 创建日期常量
pre_y = model.predict(numpy.array(new_x).reshape(-1, 1))    # 对日期常量new_x输入模型进行预测
print ("2019-10-17预测的销售数据为:")
#print(pre_y[0][0])
pre_data = round(pre_y[0][0],1)
print(pre_data) # 输出保留一位小数

#########预测出来的数据->折线图 2019-10-17
x3=[]
y3=[]
x3.append(x5[-1])
y3.append(y5[-1])
x3.append('2019-10-17')
y3.append(pre_data)
##############
x_major_locator=MultipleLocator(40)
#把x轴的刻度间隔设置为1,并存在变量里
ax=plt.gca()
#ax为两条坐标轴的实例
ax.xaxis.set_major_locator(x_major_locator)
#把x轴的主刻度设置为1的倍数
pyl.ylim(10,100)
pyl.plot(x5,y5,'y',linewidth=0.7)
pyl.plot(x5,y5,'o')
pyl.plot(x3,y3,'r')
pyl.plot(x3,y3,'o')

plt.tick_params(labelsize=8)
plt.gcf().autofmt_xdate()
pyl.title("Sales data")
pyl.xlabel("Date(2019-01-01/2019-10-17)   2019-10-17 Sales is:"+str(pre_data))
pyl.ylabel("Sales amount")
pyl.savefig('Predict.jpg')
pyl.show()
生成的折线图样例:
Click here to view the copyright notice of this site(点击此处查看本站版权声明)
请问您这个怎么修改array size啊,289太小了我不知道怎么修改数组尺寸
最开始的代码你生成出来了多少条数据,数组大小就对应设置。
array.reshape (289,1) 表示 将原数组元素变为289行1列
x = numpy.array(x).reshape([289, 1])
y = numpy.array(y).reshape([289, 1])
我是修改的这里,但是显示报错cannot reshape array of size 289 into shape (942,1),所以我就不知道应该改哪里才能修改尺寸,我是直接全部运行的,包含不了我的所有数据我才想修改尺寸
您有其他联系方式吗?我刚开始学太小白了
Vx LzRestarting
你可以把对应的数组打印出来看看,可能你生成的数据有问题
好的 太感谢了
真是太感谢了 我差不多弄懂了 主要是预测值的计算方法不太理解,也没看明白是怎么计算的 哭
预测值用的是机器学习的线性回归算法。这个要自己去了解了。https://github.com/wanglei18/machine_learning/tree/master/Codes/linear_regression
Python导入库就可以直接调用使用。
哈 还有一个问题哈 就是这个挺像是我们学习过的牛顿插值法?这个是牛顿差值法么?
还是样条?
大佬可不可以稍微讲解一下下
生成数据->获取数据->模拟预测->图表显示。你可以把不明白的地方的数据输出下,最后的图是由生成的数据和预测的数据拼起来的
你可以后台个人资料里面填填电子邮件,不然评论收不到实时消息。
妙啊妙啊